SaaS KPIs: Metrics That Will Keep Your Business On Track
If you’re building a SaaS company, you need to grow at a rapid pace in order to establish a strong, profitable presence down the road. That’s why most SaaS KPIs (key performance indicators) will give you insight into your growth.
Successful SaaS ventures put performance statistics and metrics at the forefront of their business. Paying attention to the numbers, especially the right numbers, helps make sure you’re on the right path towards growing a successful company.
Let’s take a closer look at which SaaS KPIs to track, and why you need to start measuring them today.
Start measuring growth now, even if it feels early
As soon as you have incoming revenue, you need to establish guides and measures for your SaaS company.
According to early stage B2B SaaS VC fund Senovo, many young companies do not track meaningful metrics. They argue that you need to start tracking SaaS KPIs early because the record of metrics will help you manage your company well, and they also aid in later discussions about funding.
Today’s decisions will influence tomorrow’s performance. KPIs not only give you a snapshot of your business’s current health, but guide you towards a focus. Subscription based software-as-a-service businesses are future-focused. You need to be one step ahead of your competitors as well as the ever-evolving tech landscape, because you are relying on your venture’s future income to keep your business sustainable. This is why it’s essential to keep an eye on data trends and your SaaS KPIs from day one.
No matter which market your SaaS business model caters to, you will find appropriate metrics to track. Define which KPIs mean the most to your business and start tracking them now.
SaaS KPIs that track revenue
Most SaaS KPIs boil down to either money coming in or money going out. Let’s look at metrics that help you understand the money coming in first.
Monthly Recurring Revenue (MRR)
MRR is commonly recognized as the lifeblood of a SaaS company.
As the name states, your MRR consists of all of your recurring revenue normalized to a monthly amount. Take the number of customers in a month and multiply it by the average monthly billed amount to get your MRR.
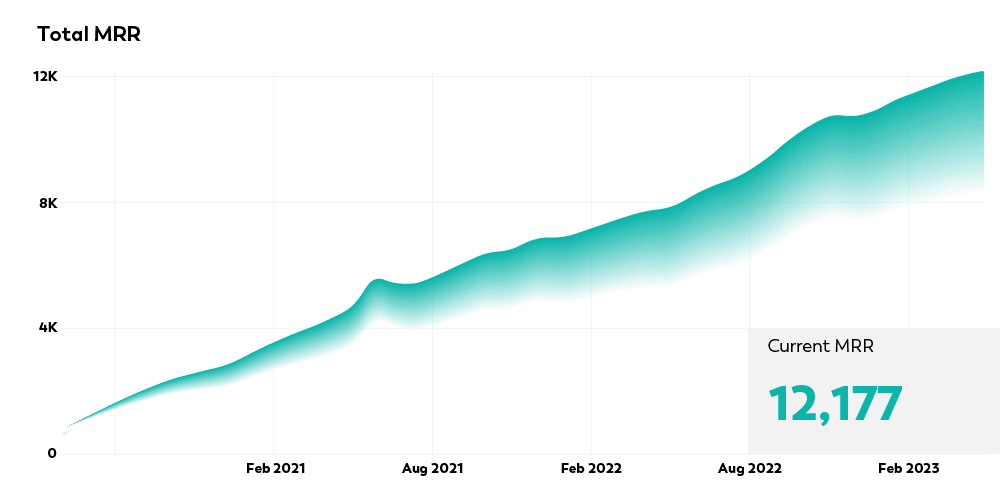
For example, if 5 customers are paying you $50/month, your MRR would be $250. Pietro Bezzo, co-founder of Connect Ventures, believes that MRR is a vital metric that investors look at when evaluating the health of a business. MRR helps you plan ahead by forecasting finances coming in, as well as predicting growth momentum.
Use a line plot like this to visualise your MRR trajectory.

A key point to remember is that MRR is only a measure of your revenue and not your profit.
Use it to estimate how much revenue your SaaS is generating on a monthly basis, but keep in mind that this exists only as long as your customer is doing recurring monthly business with you. Don’t be misled by exponential growth during the early stages of your start-up, which will plateau as your company matures and establishes a steady pace.
Annual Recurring Revenue (ARR)
Your ARR goes hand in hand with MRR. Simply put, the ARR is the total of your MRR for a year, or monthly recurring revenue multiplied by 12.
If your SaaS company serves enterprises, you may want to focus more on annual recurring revenue as a key metric instead of MRR, according to Dave Kellogg. He argues this is because most enterprise-level businesses use annual contracts as opposed to monthly.
ARR can give insights into pricing decisions. For those SaaS ventures that offer annual subscriptions, for example, you may wish to consider adjusting renewal prices to improve profitability. If your customer is happy with your service, they may be happy to be back for more at a different, and even increased, price point.
An important thing to remember when calculating your ARR is the word recurring. If you offered a discount during the year, you will not be able to include it in your ARR. Only when your customer starts paying your full price do you include it in full value for your ARR.
Extend your MRR line plot to visually follow the ARR of your SaaS for the whole year.
Average Revenue Per User (ARPA)
Variations of this SaaS KPI metric let you tailor it to your business model. Each of these means essentially the same thing: how much revenue each customer, user or account is bringing you per month.
- Average Revenue Per Account (ARPA)
- Average Revenue Per Customer (ARPC)
- Average Revenue Per User (ARPU)
To find your ARPA, take your MRR and divide it by the number of customers you have.
David Skok of Matrix Partners advises SaaS businesses to calculate the ARPA metric for fresh customers separately from more established customers. “Plot a trend line to show you the average price point that your new customers have chosen”, he recommends. By keeping your new and existing ARPA trends separate, you will be able to accurately compare the behaviours of customer groups alongside your changing price point.
The ARPA metric is useful for internal benchmarking and comparing your own customer base between periods. But keep in mind that anomalies can skew your average. As Ravi Parikh points out, a single account can throw your average off giving you a false positive or misleading outcome. If you have a significant price range between two of your biggest accounts, you will need to look at the bigger picture and be smart about showcasing your pricing strategy externally.
KPIs that measure costs
So far we’ve covered SaaS KPIs that measure revenue. Now it’s time to look at metrics that measure costs and other forms of loss.
Churn
Your ‘customer churn rate’ or ‘logo churn’ refers to the percentage of patrons that leave your business every month. If you have an annual subscription model, then you need to calculate your churn rate per year rather than (or in addition to) monthly.
Because subscription-based SaaS models depend on new customers as well existing customers, your churn rate is one of the most important numbers to look at for customer retention.
The longer you are in business, the lower your churn rate should be. Here’s why – a churn rate of 3% of your first 100 customers means you’ve lost 3 customers in the first month. This is not going to shut you down. However, 3% of a million customers means losing 30,000 patrons, and that’s definitely not okay.
As Lars Lofgren from Kissmetrics says, keep your monthly churn rate at 1-2%. Above 5% and you need to drop everything else until you lower it.
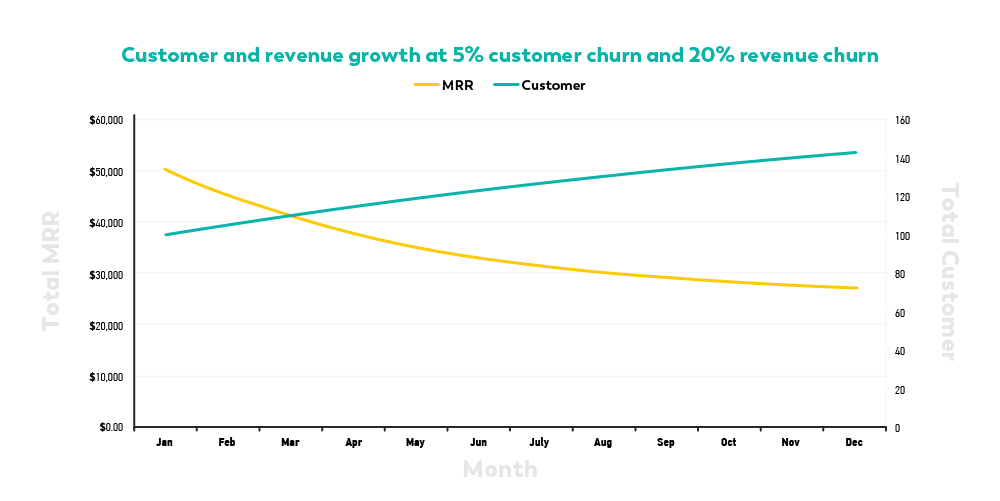
Once you’ve figured out your customer churn rate, use it to track your revenue churn rate – the revenue you have lost due to cancellations. Put them both together and you’ll observe a trend like the below:

By studying the relationship between customer and revenue churn, you’ll be able to see which area needs attention. It could be your price point, customer relationship, competitor activity or change in market dynamics. Start with getting feedback from your customers and see where that leads you.
Customer Acquisition Cost (CAC) + Payback
You spend time, money and effort to get customers. The cost of acquiring them, your CAC, is the total of all sales and marketing costs incurred when bringing in a new customer.
It is natural for you to spend more when you start, but eventually income will have to overtake expenditure. As Jordan McBride cautions, if you’re too stingy about your CAC, you risk losing out on potential customers, and if you’re spending too freely you’re not going to make a profit. The challenge lies in “spending the right amount to drive new customers to your service without jeopardising revenue”.
Divide your marketing spend by the number of users to calculate a basic CAC, and then look at payback.
According to Baremetrics, the average payback time for a SaaS is 12 months. Dave Kellogg calculates the CAC Payback Period by dividing CAC by MRR per customer.
So the less you spend to acquire customers, the better — right? You’d think so, but it depends on how long your new customer sticks around. Which brings us to our final SaaS metric.
Lifetime Value (LTV)
Let’s call this a continuation of the CAC metric, as these two metrics work closely together. The LTV predicts how much revenue you will get from a customer for the duration of their subscription with your SaaS. We love Neil Patel’s simple method of multiplying the average subscription length by the ARPA.
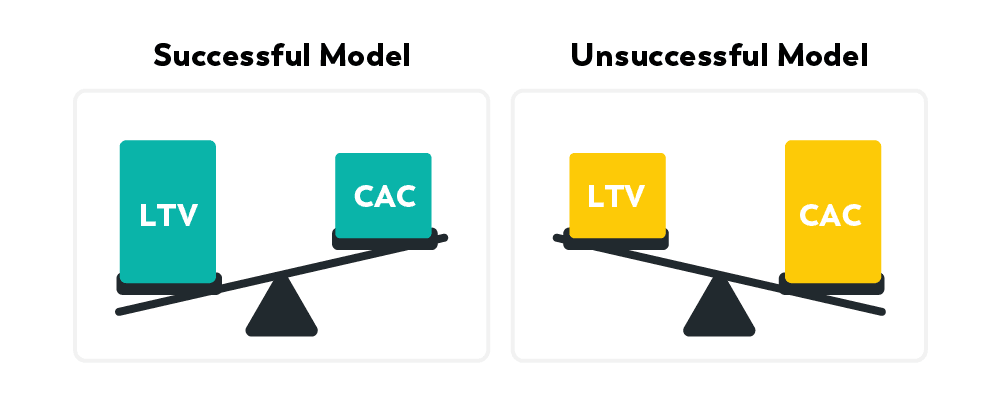
You can also use the commonly used LTV to CAC ratio. Jordan McBride suggests to benchmark this at 3. That is, for every dollar you put in, you need to get $3 back.

The lifetime value should be at least 3X larger than what you’ve spent on acquiring that customer for it to be worth your time. Focus on the long-term and you should be able to recover these figures by the 12-month mark. If not, then you need to take a look again at your expenditure.
Clint Fontanella offers up two ways to improve your LTV: customer satisfaction and customer retention. Basically, keep your customer happy and they’ll come back for more.
Don’t try to implement every SaaS KPI at once
There are plenty more SaaS KPIs out there, but don’t let the metrics overwhelm you. We recommend you choose two or three to view alongside each other, rather than obsessing over one KPI or trying to implement all of them at once. Also keep an eye on things like profit margins, inventory and number of people you hire.
As a SaaS venture, you need to be agile enough to adapt. So revisit your company’s goals every quarter to see if you’ve met your KPIs and what you did differently. Remember, the core essence of a SaaS is to be customer-focused and aligned with the future, while keeping your venture sustainable, efficient and smart.