Reducing the churn rate is a crucial parameter in the SaaS sector. By most metrics, it’s even more important than acquiring new customers. Every customer that leaves equates to a big loss after all your hard work to acquire that person. SaaS cohort analysis provides invaluable insight into user behavior and the main reasons behind churning.
What is a cohort?
Before we get into an in-depth explanation of cohort analysis, let’s examine what a cohort is. In the SaaS industry, a cohort is a sub-group of your target demographic. Cohort analysis examines two types of cohorts: acquisition cohorts and behavioral cohorts.
Acquisition cohort
This represents the group of users who signed up for your service within a specific timeframe. For example, it may represent all the customers who signed up for the paid version of your product in the first quarter of 2022.
Behavioral cohort
Behavioral cohorts are groups that performed specific actions with your product. Examples may include members who used a particular feature, signed up for premium membership, etc.
SaaS cohort analysis defined
Now that we understand what a cohort is, a cohort analysis is much more self-explanatory. It’s an analytical framework that provides data of a sub-section of your user base. The aim is to acquire data that may improve customer lifetime value and reduce the churn rate.
Cohort analysis in SaaS helps you direct your focus where it matters. For instance, the analysis may show the churn rate is higher than average within a behavioral cohort group that signed up for the basic membership plan. With this information, you can take remedial action, such as adding features to the base plan.
Why SaaS cohort analysis matters
Cohort analysis provides an overview of consumer behavior and may yield clues on why customers may be churning at higher rates. It provides input such as:
- Behavioral metrics that (for better or worse) impact customer lifetime value
- Metrics that may improve the sales funnel
- How recent updates to your product have impacted churn rates
- How long it takes, on average, for users to become disengaged and eventually cancel
Armed with this data, you can start making adjustments to get retention rates up in areas with above-average churn rates.
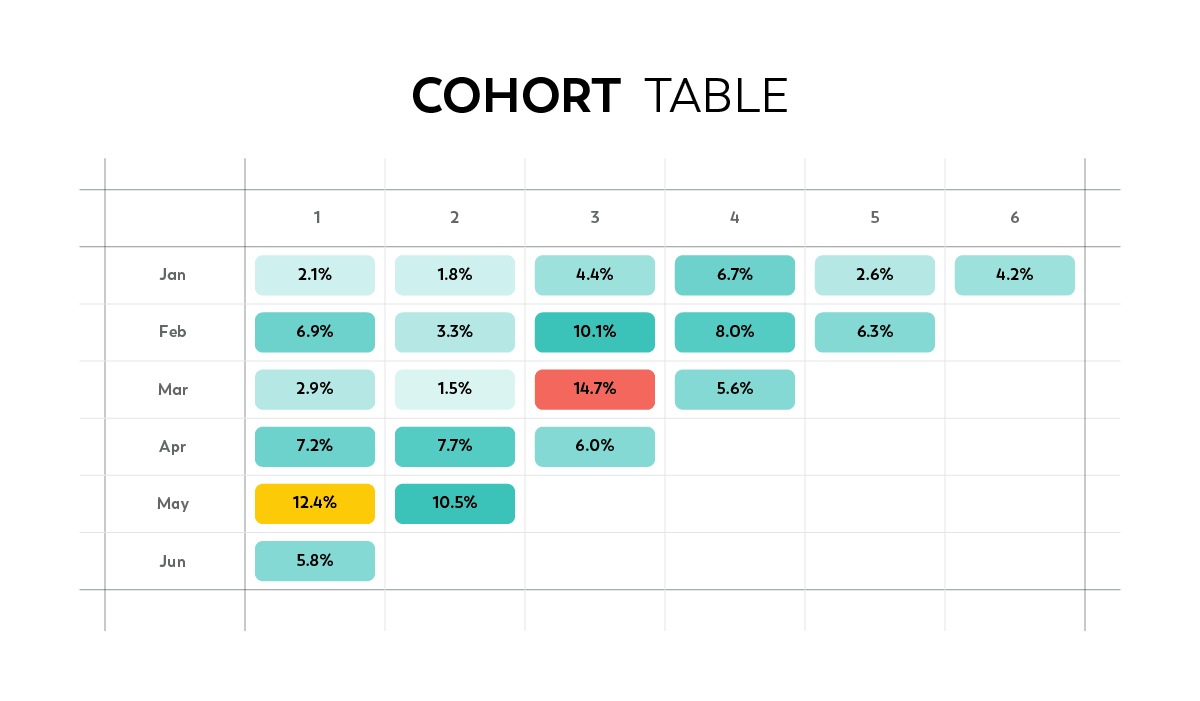
Cohort table
A typical SaaS cohort analysis is configurated using a table. It may include data input like the following:

- Column (top to bottom): Consists of a timeframe over six months
- Row (left to right): Represents the amount of time that elapsed since a cohort group signed up.
- Individual cells: Each cell contains a percentage indicating the churn rate. The cell highlighted in red indicates that 14.7% of users who signed up in March canceled after being a subscriber for three months. Color-coding can also be used to emphasize abnormally high churn rates.
With cohort analysis software, you can easily create a cohort table and have the AI input the latest data. Instead of timeframes, you can input behavioral metrics of your choosing.
Example SaaS cohort analysis in action
The above table is an example using acquisition cohort data. Here’s an example scenario utilizing behavioral data.
Let’s say you have a B2B cloud-based system. You use cohort analysis to determine the churn rate of two variables:
- Customers who signed up by clicking on the CTA in your email newsletter. There were a total of 100 signups
- Customers who signed up through the description link in your YouTube demonstration video. There were a total of 200 signups.
You create an analyst table and fill in the cells. By examining the data, you gain the following insight by the end of a set period:
- Customers who signed up through your email newsletter have a 25% churn rate, meaning 75 subscribers remain.
- Customers who signed up through your YouTube description link have a 75% churn rate, meaning 50 subscribers remain.
What can you conclude from this data? Despite the YouTube subscribers having a higher sign-up rate, the churn rate is also far higher, resulting in fewer remaining subscribers by the end of a set period. With this knowledge, you can redirect your efforts to crafting high-quality newsletters rather than sending users to your YouTube video.
Reduce your churn rates with VeryCreatives
VeryCreatives partners with SaaS enterprises and assists in the development, planning, and execution of the software development cycle.
We can also examine your churn cohort analysis or develop an analysis plan for you so you know where churn rates are occurring and why. Book a call with VeryCreatives today to get started!
